
Bank Strategy Briefing: Midwest bank M&A 2017 year in review
Bank Strategy Briefing: Midwest bank M&A 2017 year in review
Authored By

Peter Wilder
Practices
In January 2017, we predicted that Wisconsin bank M&A volume for the year would return to more traditional levels after a significant run-up in deal making from 2014 to 2016. “Traditional” M&A volume in Wisconsin over the past 25 years is approximately seven to eight whole bank mergers per year, and our prediction turned out to be nearly spot-on with six whole bank deals announced in Wisconsin for the year. That compares to an average of 12 whole bank deals per year during 2014-2016.
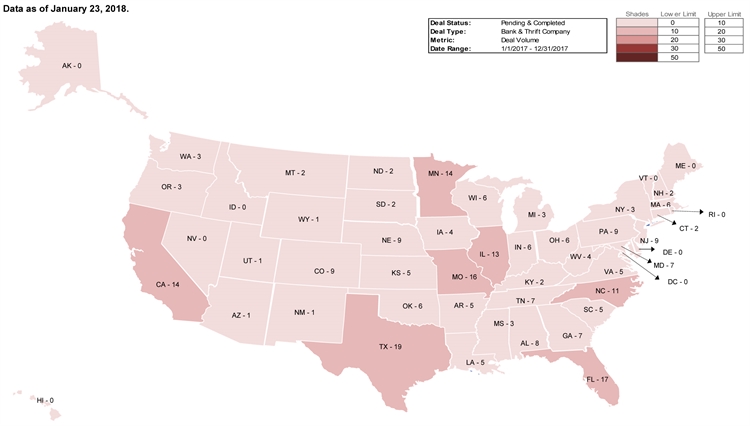
Interestingly, M&A activity in many other Midwestern states varied widely, with some states seeing a substantial increase in deal announcements. However, one fairly consistent trend across the Midwest and the nation appears to be steadily increasing deal pricing. Following is a summary of select bank M&A metrics in the states we often follow, as well as how the average metrics for these markets compare to a national benchmark. The data is followed by a nationwide heat map showing that in 2017 the Midwest continued to see elevated bank M&A activity as compared to most other regions.
Number of deals & target data
| State | 2017 Number of Deals1 | 2016 Number of Deals | YOY Change in Number of Deals2 | 2017 Average Target Assets (000s) | 2017 Rate of Consolidation |
|---|---|---|---|---|---|
| Illinois | 13 | 19 | ↓31.6% | 530,313 | 4.2% |
| Iowa | 4 | 6 | ↓33.3% | 183,800 | 1.7% |
| Michigan | 3 | 7 | ↓57.1% | 260,784 | 5.8% |
| Minnesota | 14 | 11 | ↑27.3% | 292,288 | 1.6% |
| Missouri | 16 | 11 | ↑45.5% | 113,439 | 3.9% |
| Wisconsin | 6 | 17 | ↓64.7% | 632,366 | 5.0% |
| Average | 9.33 | 11.83 | ↓21.1% | 335,498 | 3.7% |
| National | 262 | 240 | ↑9.2 | 601,563 | 4.4% |
Source: SNL Financial
Pricing for publicly reported deals
| State | 2017 Average Price/TBV | 2016-2017 YOY Change in Average Price/TBV | 2017 Average Price/LTM Earnings | 2016-2017 YOY Change in Average Price/LTM Earnings |
|---|---|---|---|---|
| Illinois | 155.6x | ↑22.9% | 22.8x | ↓4.6% |
| Iowa | 144.2x | ↑10.2% | 27.4x | ↑93.0% |
| Michigan | 175.7x | ↑33.5% | 21.3x | ↑25.3% |
| Minnesota | 174.0x | N/A3 | 16.5x | N/A3 |
| Missouri | 136.8x | ↑20.7% | 20.0x | ↓4.3% |
| Wisconsin | 140.1x | ↑13.3% | 30.1x | ↑28.4% |
| Average | 154.4x | ↑20.2% | 23.0x | ↑22.2% |
| National | 165.0x | ↑21.3% | 22.8x | ↑1.3% |
Source: SNL Financial
Source: SNL Financial
Given the above data and what we saw in the bank M&A marketplace in 2017, here are some key takeaways as seen by our attorneys.
- Volatility. Although similar market forces are at work in all Midwestern states, M&A activity varied dramatically. The Midwest was due for a cooling off period, especially given the uncertainty following the 2016 presidential election, but many Midwestern states—and the nation as a whole—saw a material increase in M&A. This volatility is likely due to simple happenstance, but also the ebb and flow of incentives to sell or remain independent such as M&A pricing, bank stock prices, interest rate policy, succession planning, tax reform, and legislative efforts for regulatory relief.
- Pace of Consolidation. Nationally, the rate of bank consolidation was the highest it has been in at least the last 9 years at 4.4%.4 At least some of that consolidation is a result of deals announced in 2016 that were closed in 2017, so it is not necessarily indicative of a groundswell of seller desire in 2017. However, it remains a noteworthy statistic to say the least.
- Pricing. Locally and nationally, pricing for acquisitions is on the rise. Prices were bolstered by, among other things, healthy sellers as well as runaway acquirer stock price valuations and the thaw in interest rates. We believe pricing will continue to increase into 2018, particularly given the now certainty of the reduction in the federal corporate income tax rate that should positively impact bank earnings.
In our next edition of Bank Strategy Briefing, we will give our predictions for bank M&A in 2018.
1 Whole bank deals announced in 2017 where the seller is located in the state indicated.
2 Increase or decrease in announced whole bank deals from 2016 to 2017.
3 No publicly reported pricing data for 2016.
4 Source: Olsen Palmer, The M&A Monitor, 2017 Year in Review.
Authored By